
Finding π on a Hardwood Floor
Drop a needle on wooden planks. The chance it crosses a crack has π in it, and there isn’t a circle anywhere in sight.
Imagine a hardwood floor made of long wooden planks. Every plank is exactly the same width. Let’s call that width d.
You are holding a straight needle. To keep the maths simple, the needle is exactly as long as a plank is wide: its length is also d.
You toss the needle into the air and let it fall wherever it likes. Sometimes it lands neatly inside one plank. Sometimes it lands across the crack between two planks.
What is the probability that the needle lands crossing a crack?
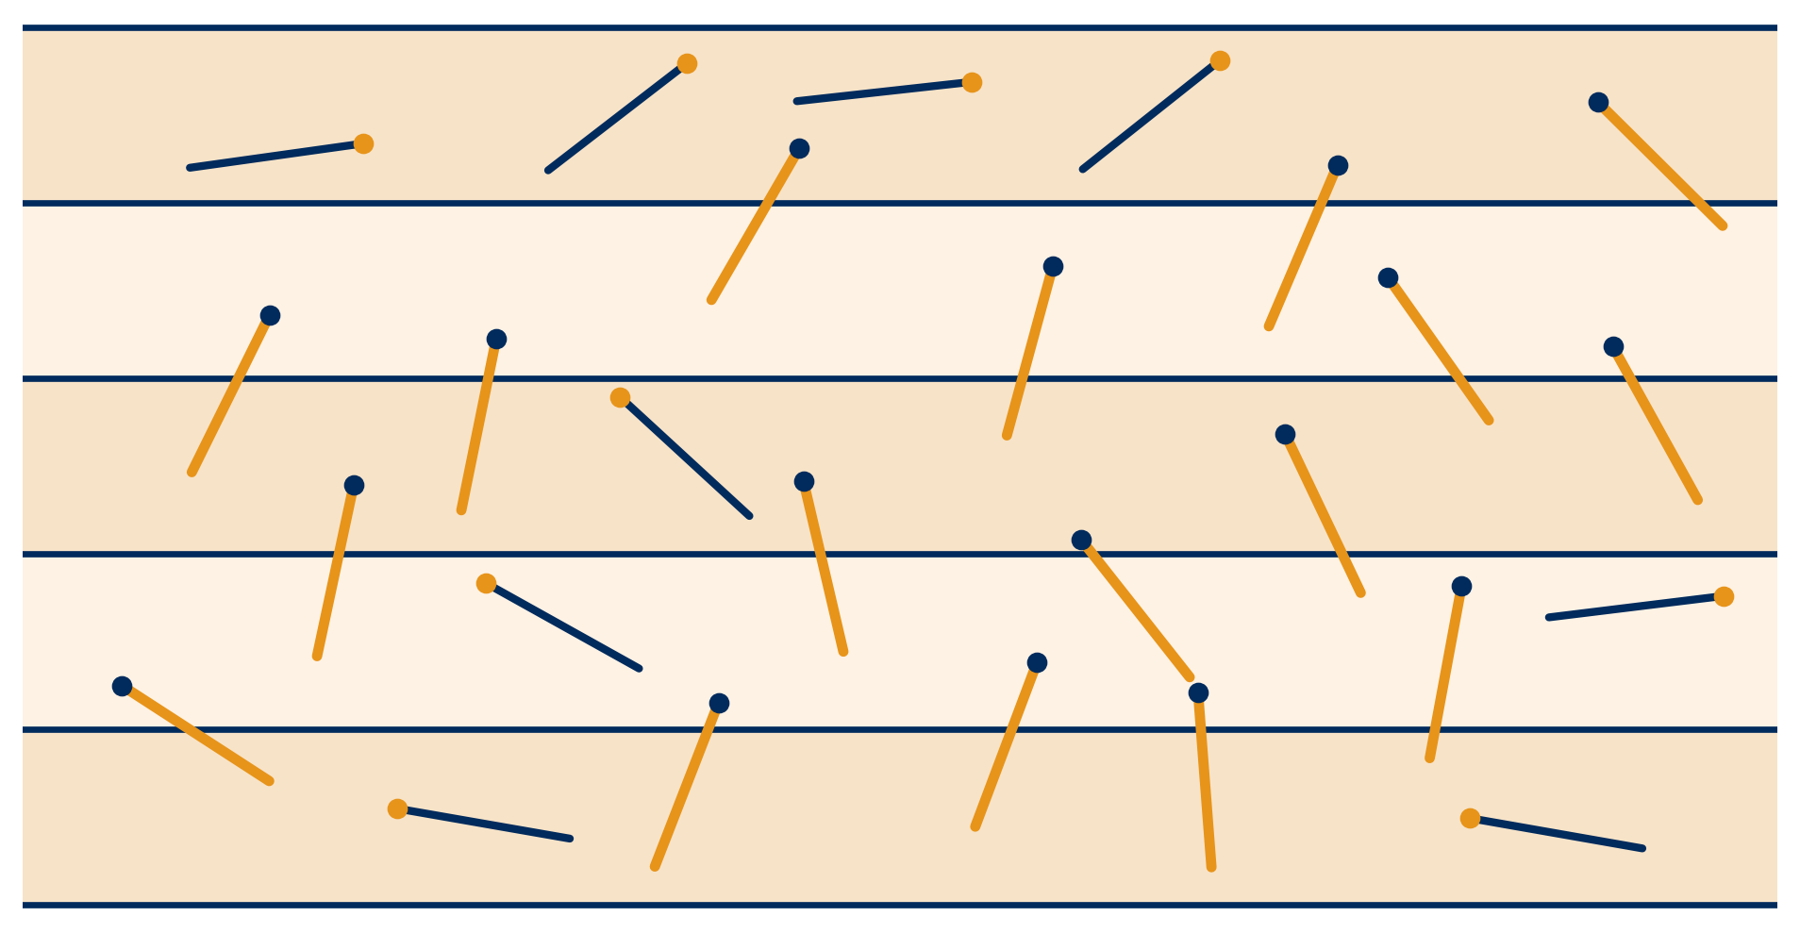
This puzzle has a name and a long history. It is Buffon’s needle, first posed in 1733 by the French naturalist Georges-Louis Leclerc, Comte de Buffon, and one of the oldest problems in geometric probability.
Chasing the Extremes
Before doing any algebra, let’s look at the two most extreme ways the needle can land.
Suppose the needle lands parallel to the cracks, running along the length of the plank. It lies entirely inside one plank and never touches a crack. The chance of crossing is 0.
Now suppose it lands perpendicular to the cracks, pointing straight across the planks. A needle of length d lying across a plank of width d cannot fit inside a single plank, so it always crosses. The chance of crossing is 1.
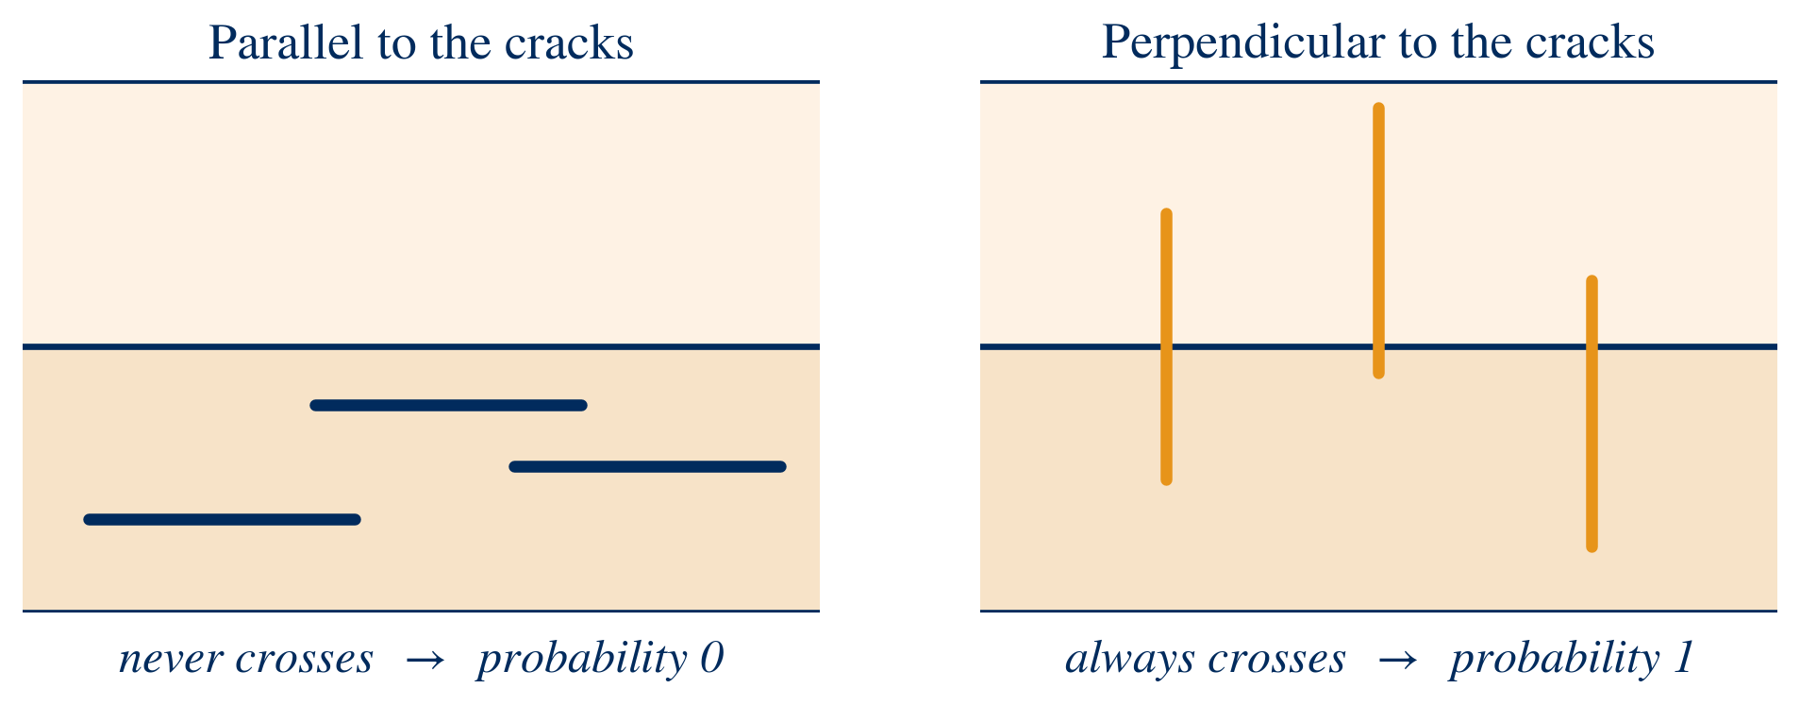
Every real toss lands somewhere between these two extremes, so the answer must lie somewhere between 0 and 1. To find out where, we need a way to describe a tilted needle.
The View from the Bottom
To solve this, let’s track just one point: the bottom tip of the needle, meaning whichever end lies lower down the floor in our picture.
When the needle lands, that bottom tip sits somewhere on a plank. Let’s call its distance from the lower edge of that plank y. Because the tip can land anywhere on the wood, y can be any value between 0 and d.
Because the bottom tip is the lowest point of the needle, the rest of the needle points upward from it. That means the needle can never cross the crack below the tip. The only crack it can cross is the next one up, at height d.
Take the perpendicular case first. The top tip sits at height y + d, and it crosses the next crack when y + d > d, which simply means y > 0. Since landing exactly on the crack has zero chance, the needle crosses with probability exactly 1, just as we found above.
But most needles don’t land perpendicular. Let’s call the tilt \theta: the angle between the needle and the perpendicular to the cracks. It runs from 0 (perpendicular) to \pi/2 (parallel).
How far up does a tilted needle reach? Picture a right-angled triangle with the needle as its slanted side, of length d. The vertical side of that triangle, the part of the needle’s length that actually points across the planks, is the side next to the angle \theta. By basic trigonometry, its length is d\cos\theta. The other side, d\sin\theta, runs along the plank and doesn’t help the needle reach the crack at all.
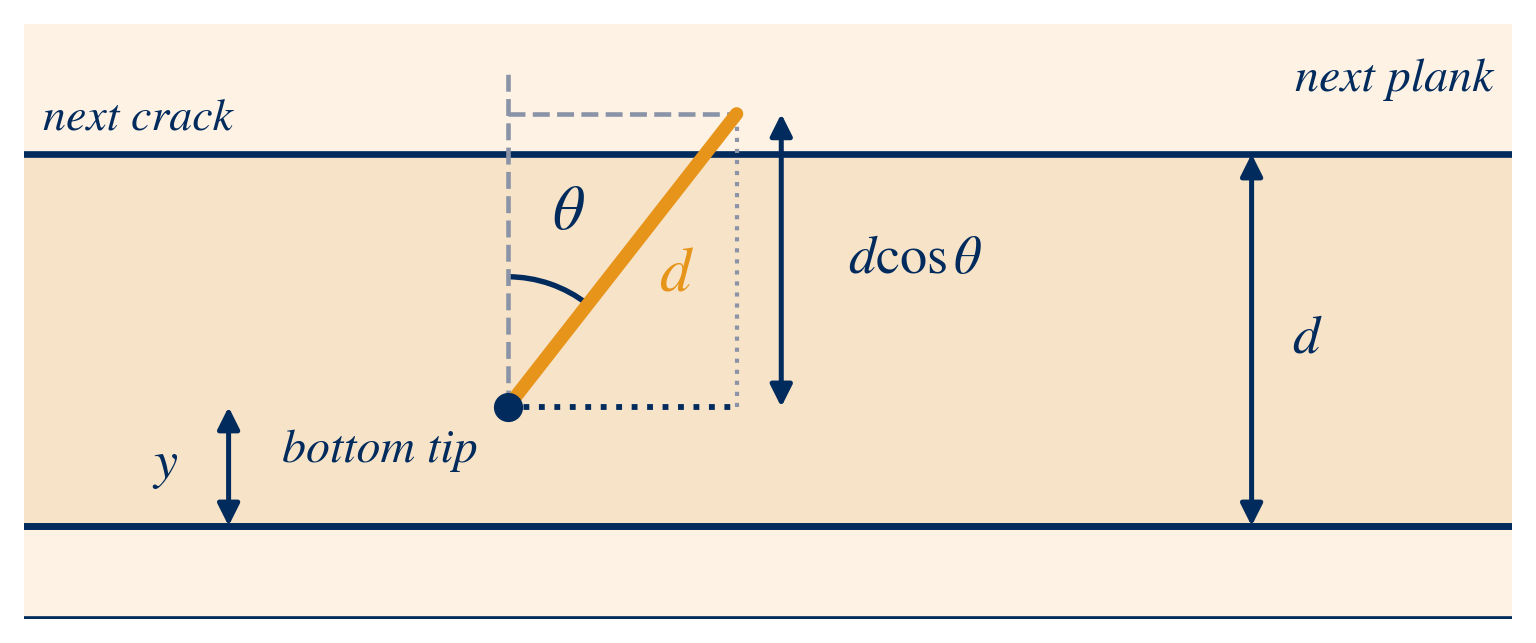
So the top tip reaches a height of y + d\cos\theta, and the needle crosses the next crack when that is more than the width of the plank:
y + d\cos\theta > d .
Rearranging tells us exactly where the bottom tip needs to land:
The needle crosses a crack when \;y > d - d\cos\theta.
Every Possible Drop in One Rectangle
Now let’s put this on a graph. The horizontal axis is the angle \theta, from 0 to \pi/2. The vertical axis is the bottom tip’s height y, from 0 to d.
Every possible way the needle can land is now a single point in a rectangle. Because we toss the needle without aiming, every position along the plank and every tilt is equally likely, so every point in the rectangle is equally likely too. That turns probability into area. The total area of the rectangle is its width times its height:
\text{Total area} = \frac{\pi}{2} \times d = \frac{\pi d}{2}.
The winning drops, where the needle crosses a crack, sit above the curve y = d - d\cos\theta and below the top of the plank at y = d.
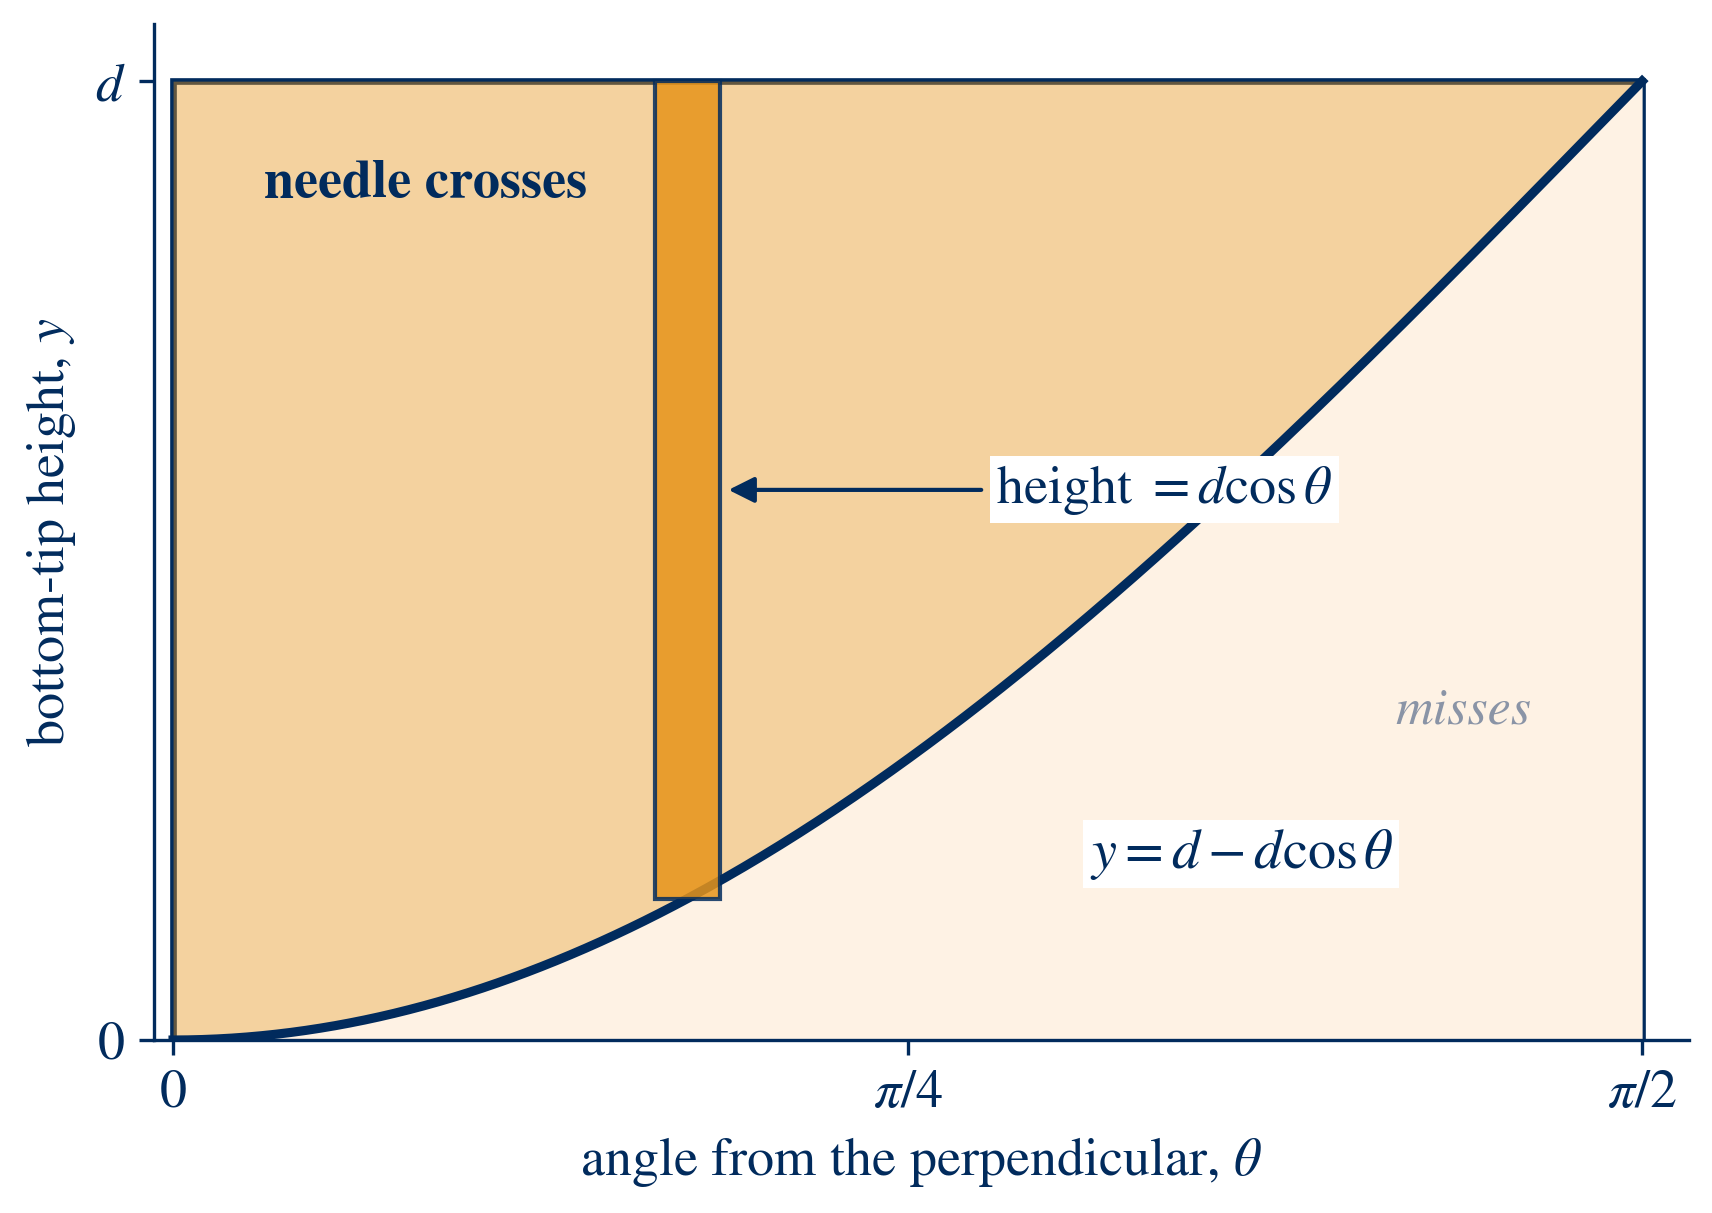
The winning region has a curved edge, so we find its area with calculus. Slice it into thin vertical strips. At angle \theta, a strip starts at the curve, d - d\cos\theta, and runs up to d, so its height is
d - \left(d - d\cos\theta\right) = d\cos\theta .
Adding up all the strips from \theta = 0 to \theta = \pi/2:
\text{Winning area} = \int_0^{\pi/2} d\cos\theta \, d\theta = d\Big[\sin\theta\Big]_0^{\pi/2} = d\,(1 - 0) = d .
To get the probability, divide the winning area by the total area. The ds cancel:
P(\text{cross}) = \frac{d}{\pi d/2} = \frac{2}{\pi} \approx 0.6366
A Second View: The Centre Method
There is a second way to solve this, by looking at the centre of the needle instead of its tip.
Let x be the distance from the centre of the needle to the nearest crack, whether that crack is above or below. The furthest the centre can ever be from a crack is the middle of the plank, so x runs from 0 to d/2.
The centre sits halfway along the needle, so each half has length d/2. Tilted at angle \theta, each half reaches \tfrac{d}{2}\cos\theta across the planks, by the same right-triangle argument as before.
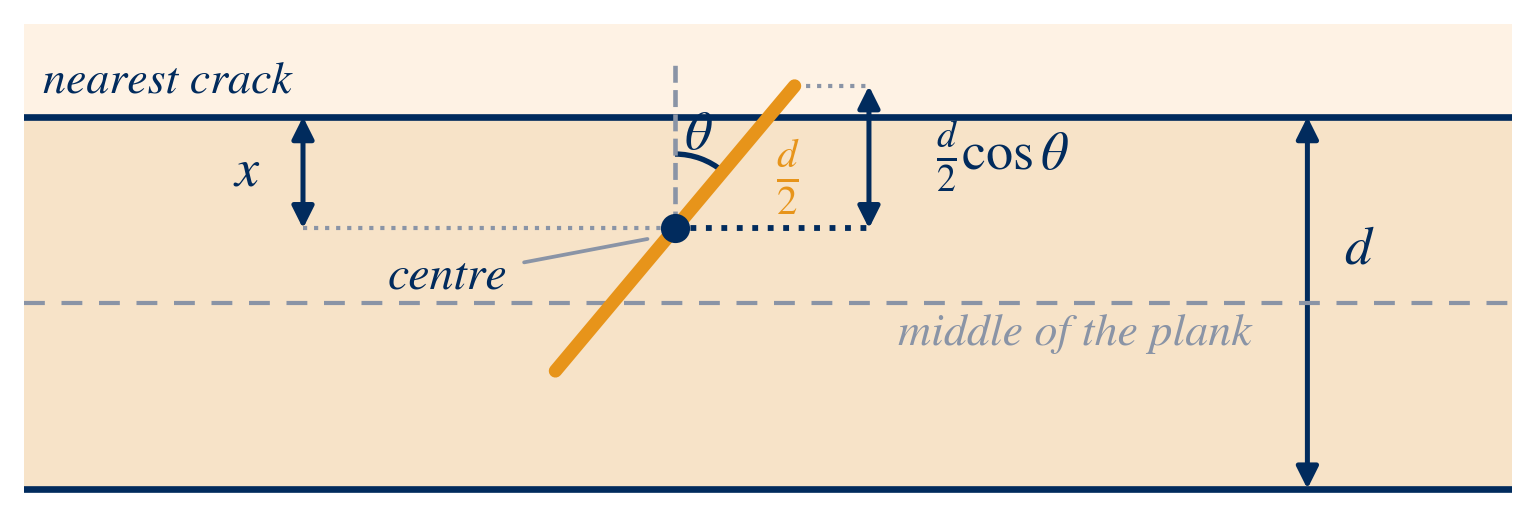
The needle crosses when the nearest crack is within reach of the half pointing towards it:
x < \frac{d}{2}\cos\theta .
We can graph this just as before. The angle \theta still runs from 0 to \pi/2, but the height x now only runs from 0 to d/2. The total area of this rectangle is
\frac{\pi}{2} \times \frac{d}{2} = \frac{\pi d}{4}.
This time the winning region sits under the curve x = \tfrac{d}{2}\cos\theta.
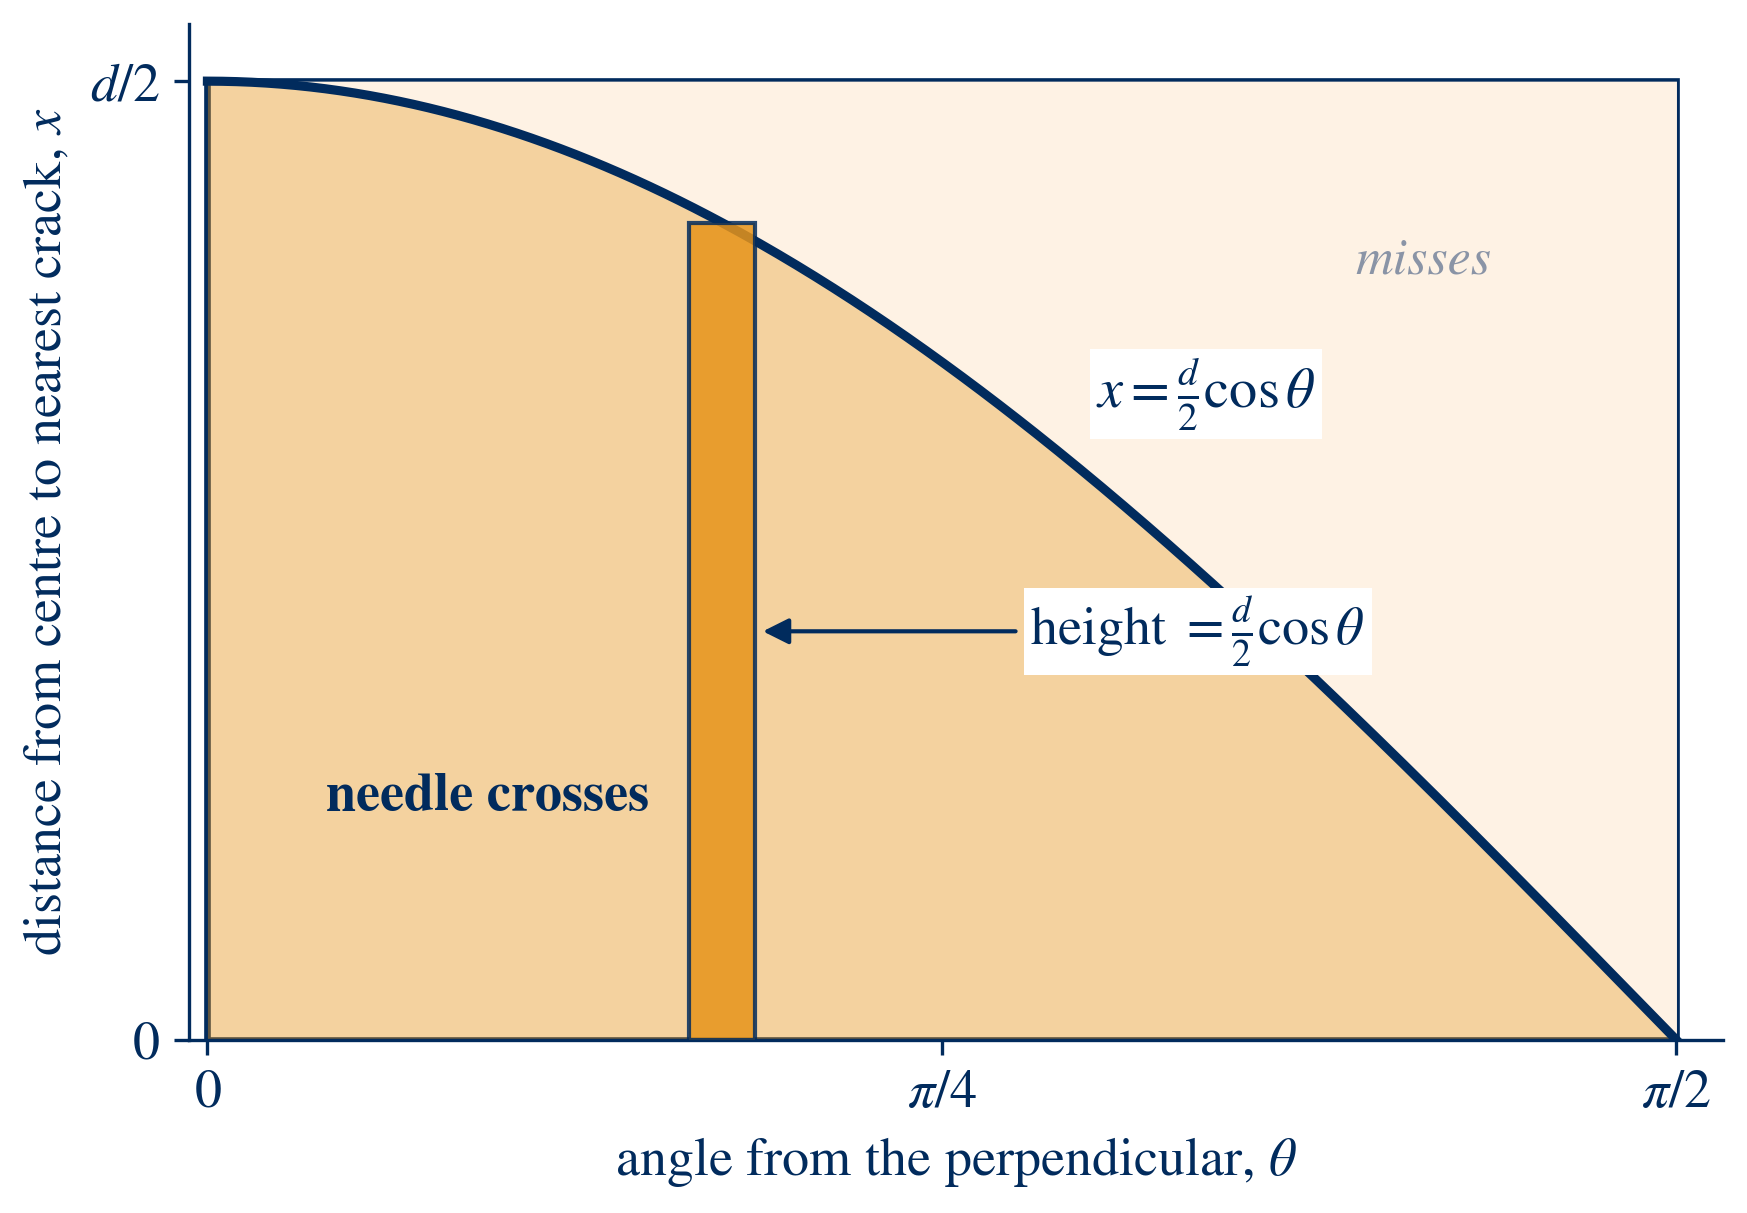
A strip at angle \theta now runs from 0 up to the curve, so its height is \tfrac{d}{2}\cos\theta:
\text{Winning area} = \int_0^{\pi/2} \frac{d}{2}\cos\theta \, d\theta = \frac{d}{2}\Big[\sin\theta\Big]_0^{\pi/2} = \frac{d}{2} .
Divide the winning area by the total area, and the ds and the 2s cancel again:
P(\text{cross}) = \frac{d/2}{\pi d/4} = \frac{2}{\pi}.
Two different pictures, two different rectangles, the same answer. The shaded regions look nothing alike, yet each one fills exactly the same fraction, 2/\pi, of its own rectangle.
Why No Paradox This Time?
If you read our article on Bertrand’s paradox, this might make you a little nervous. There, three reasonable ways of choosing “a random chord” gave three different answers. Here, two different methods agree. Why can we trust them?
The difference is that this time, “random” has only one sensible meaning. Bertrand’s question never said which quantity was chosen at random. Here we named our random quantities, a position and an angle, and the physical toss tells us how each one behaves. The floor looks exactly the same if you shift your view across by one plank, so the needle has no reason to prefer any spot within a plank: its position is uniform. And a tossed needle has no reason to prefer any direction: its angle is uniform. Both methods measure the same toss with these same two uniform quantities, which is why they cannot disagree.
Turning the Answer Around: Finding π with Needles
Here is where Buffon’s needle gets its fame. If the probability of crossing is 2/\pi, then we can turn the formula around. Toss many needles, count how many cross, and
\pi \approx \frac{2 \times \text{number of tosses}}{\text{number of crossings}} .
You can estimate \pi with nothing but a floor and a box of needles.
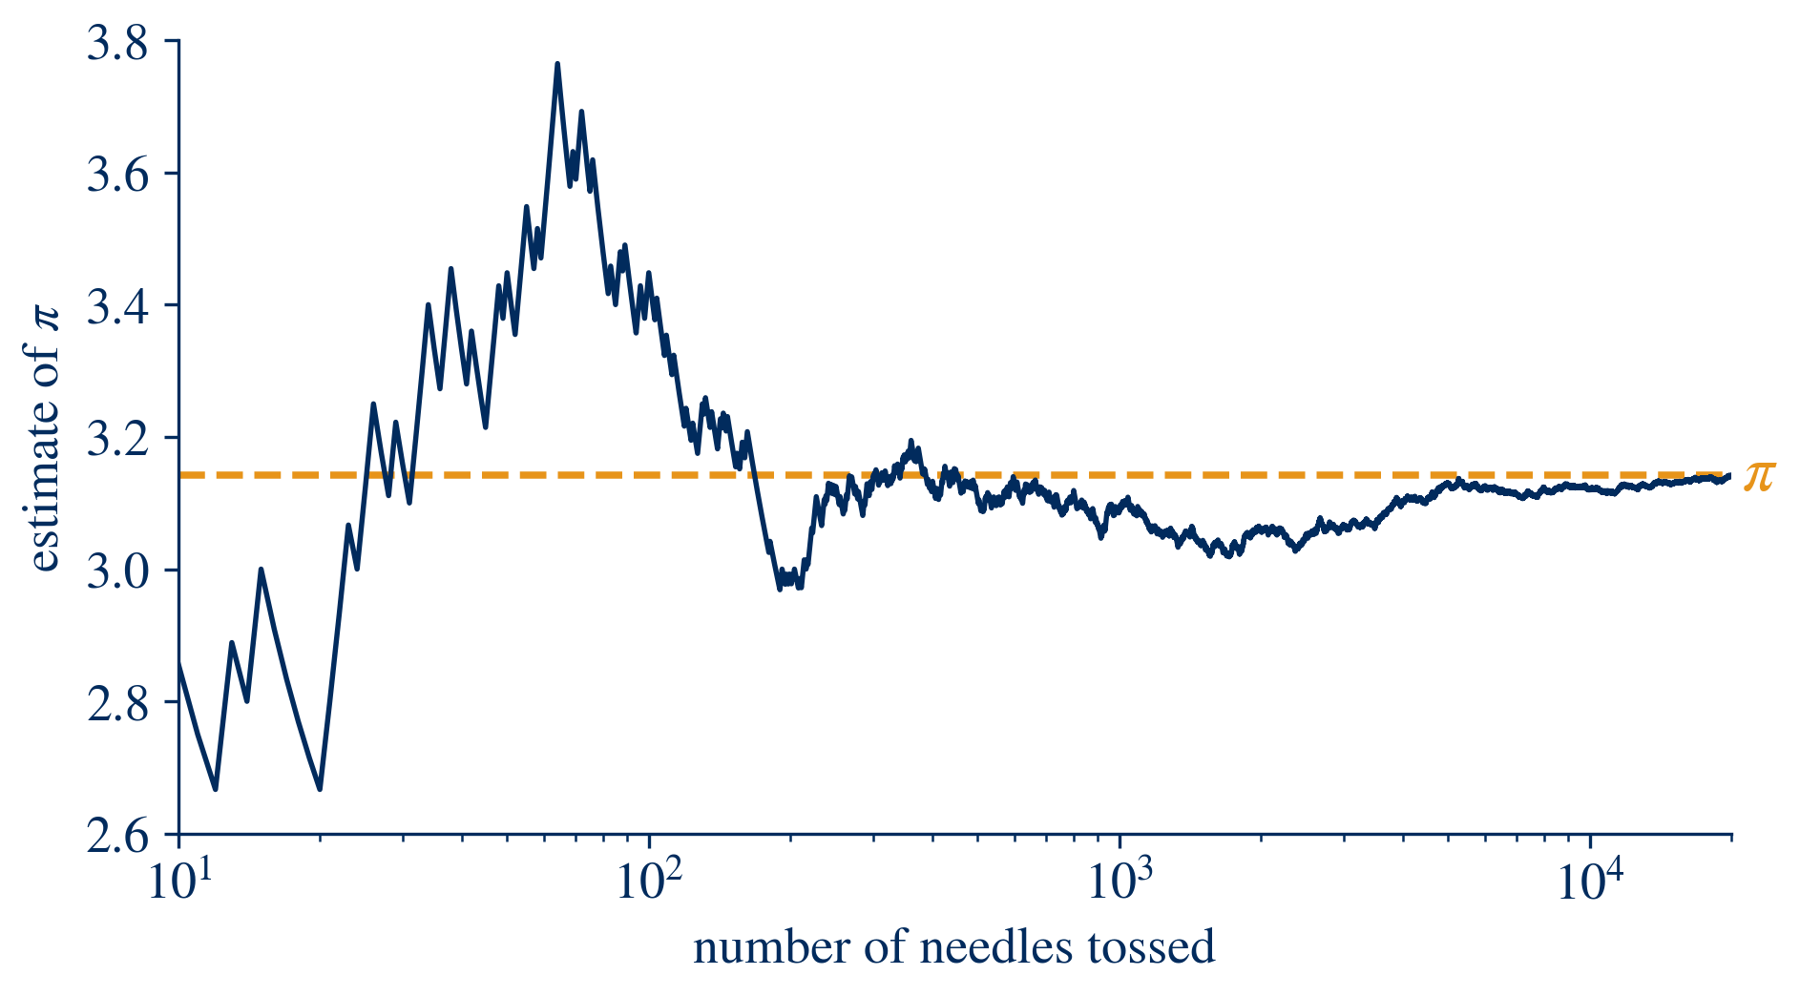
It works, but slowly. The estimate wanders wildly for the first hundred or so tosses and only creeps towards \pi after that. In this simulation, 20,000 tosses got three decimal places right. Random experiments like this improve with the square root of the number of tries, so every extra correct digit costs about a hundred times more tosses.
Which makes one historical result very strange. In 1901, the Italian mathematician Mario Lazzarini reported tossing a needle 3,408 times, using a needle five-sixths as long as the plank width. He counted 1,808 crossings, which gives
\pi \approx \frac{355}{113} = 3.1415929\ldots,
correct to six decimal places. With 3,408 honest tosses, an estimate typically misses \pi by a few hundredths. And look closely at his numbers: 3408 = 16 \times 213 and 1808 = 16 \times 113. Those are exactly the multiples needed to produce the famous fraction 355/113. It looks less like luck and more like knowing exactly when to stop.
Your Turn
1. What if the needle is shorter than the plank is wide, with length \ell < d? Only one thing changes in the bottom-tip method. Once you have your formula, check it against Lazzarini’s numbers: with \ell/d = 5/6, 3,408 tosses and 1,808 crossings, it should give exactly 355/113.
2. What if the needle is longer than the plank is wide? Try drawing the rectangle again. What goes wrong with the curve, and how would you fix it?
A straight needle, straight cracks, and still a circle hiding in the answer.